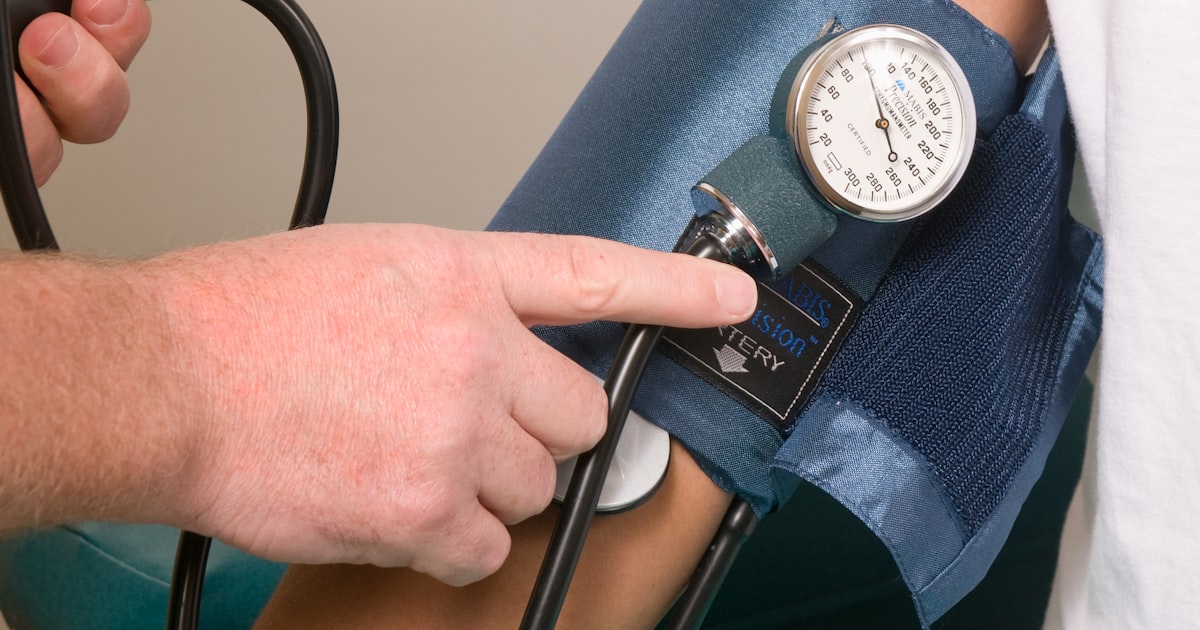
Pulse volume recording (PVR) is a non-invasive vascular test that measures the small change in limb volume that occurs with every heartbeat. Pneumatic cuffs are placed at several levels of the leg and inflated to a low, subocclusive pressure, typically between 40 and 65 mm Hg. As blood surges into the segment under each cuff, the limb expands slightly, and the recorder converts that expansion into a waveform.
That distinction matters more than it first appears. A pulse volume recording tracks volume, not pressure. Because of that, it stays interpretable in patients whose tibial arteries are too calcified to compress, which is exactly the population where an ankle-brachial index can read falsely normal or falsely high.
For independent practices, pulse volume recording is best understood as a companion to the ABI rather than a replacement for it. The ABI gives you a number. The waveform gives you a shape. Read together, they tell you whether the number can be trusted, and roughly where in the limb a problem sits. This guide covers seven things clinicians and clinical staff should understand about pulse volume recording before adding it to an in-office vascular assessment.
1. What Is Pulse Volume Recording?
Pulse volume recording is a form of plethysmography, the measurement of volume change in a body segment. A cuff wrapped around the calf or ankle is inflated just enough to couple it to the limb without occluding flow. Each cardiac cycle pushes a bolus of blood into that segment, the segment briefly expands, and the pressure inside the sealed cuff rises by a tiny amount. The instrument amplifies that fluctuation and plots it over time.
The result is a qualitative picture of perfusion in the segment beneath the cuff. Pulse volume recording does not report a blood pressure and it does not image the artery. What it delivers is a pulsatile waveform whose contour and amplitude reflect how much arterial inflow reaches that part of the limb, and how briskly it arrives.
2. How Is a Pulse Volume Recording Test Performed?
The patient rests supine while cuffs are applied to sequential levels of the limb. Commonly used levels include the high thigh, low thigh, calf, ankle, and in some protocols the metatarsal or forefoot. Each cuff is inflated in turn to the subocclusive range, a waveform is captured, and the tracing is labelled by level and side.
Two practical points drive quality. Cuff size must match limb circumference, and the cuff must sit snugly without being loose or overinflated. Both errors distort contour and flatten amplitude, which can make a healthy limb look diseased. A rest period before recording also matters, since the study assumes a reasonably steady resting state.
Pulse volume recording is usually captured in the same sitting as segmental pressures and the ABI, because the cuffs are already in place. Practices weighing who runs the study in their own workflow can review scope of practice for in-office ABI testing, which covers the same staffing question.

3. What Does a Normal Pulse Volume Recording Waveform Look Like?
A normal pulse volume recording waveform has four recognisable features: a rapid systolic upstroke, a sharp systolic peak, a well defined dicrotic notch on the downslope during early diastole, and a gradual return to baseline. The dicrotic notch is the detail most worth learning, because it is usually the first thing to disappear.
Amplitude carries information too. In a healthy limb, amplitude is broadly symmetric between corresponding segments on the right and left, and it tapers gradually as you move distally. A modest distal reduction is expected and reflects normal peripheral resistance. An abrupt drop between adjacent levels, or a clear asymmetry between limbs at the same level, is the finding that deserves attention.
One terminology caution is worth flagging, because it is a common source of confusion in charts. The familiar triphasic, biphasic, and monophasic vocabulary belongs to Doppler waveforms, which record velocity and can show flow reversal. Pulse volume recording captures volume change and has no true reverse-flow component, so PVR tracings are described by contour and amplitude instead: upstroke, peak, dicrotic notch, and height. Mixing the two vocabularies in a report makes the study harder for the next reader to interpret.
4. How Do Pulse Volume Recording Waveforms Change as Disease Progresses?
Waveform deterioration follows a fairly orderly sequence, which is what makes pulse volume recording useful for grading severity at a glance.
| Stage | Pulse volume recording waveform findings |
|---|---|
| Normal | Rapid upstroke, sharp systolic peak, well defined dicrotic notch, preserved amplitude |
| Mild change | Widened systolic peak with loss of the dicrotic notch |
| Advanced change | Reduced amplitude, delayed systolic upstroke, rounded systolic peak |
| Severe change | Markedly damped, nearly flat tracing |
Because the sequence is graded rather than binary, serial pulse volume recording studies can be informative when a limb is being followed over time. That is one reason the waveform is often reviewed alongside perfusion findings in wound care settings, where the question is frequently whether inflow is adequate for healing rather than simply whether disease is present. A worked example of that serial approach is in our guide to peripheral circulation assessment and wound follow-up.
5. Why Is Pulse Volume Recording Reliable When the ABI Is Not?
This is the single strongest argument for adding pulse volume recording to a vascular assessment. An ABI is a pressure ratio, and it depends on being able to compress the artery with a cuff. Medial calcification makes the tibial vessels stiff and poorly compressible, which is common in longstanding diabetes and in chronic kidney disease. The cuff then needs an artificially high pressure to occlude flow, and the ABI comes back normal or elevated, sometimes above 1.40, even when significant disease is present on imaging.
Pulse volume recording sidesteps that failure mode entirely. Because it measures volume change rather than occlusion pressure, a calcified vessel does not invalidate the tracing, and recognisable waveforms remain detectable. When the ABI and the waveform disagree, that discordance is itself a useful signal, and it points toward non-compressible arteries as the explanation.
The 2024 ACC/AHA multisociety lower extremity PAD guideline reflects this. When resting ABI results are unreliable because arteries are non-compressible, it points to toe pressure and the toe-brachial index, pulse volume recordings, and transcutaneous oxygen pressure as more dependable assessments of distal perfusion, and it notes that ankle Doppler waveforms or plethysmographic PVR can be used alongside the ABI to check concordance. A toe-brachial index at or below 0.70 is treated as abnormal, and digital arteries are rarely non-compressible, which is why TBI and PVR are often deployed together.
Practically, this is why pulse volume recording earns its place in practices that see a lot of diabetes and renal disease, including nephrology and podiatry populations, where a falsely reassuring ABI is a genuine risk rather than a theoretical one.
6. How Do Segmental Pressures Work Alongside Pulse Volume Recording?
Segmental pressures and pulse volume recording answer two different questions from the same cuff placement. The waveform describes the quality of perfusion at a level. The segmental pressure helps localise where flow is being limited.
The working rule is a gradient. A drop of roughly 20 mm Hg or more between adjacent cuff levels on the same limb, or a comparable difference between limbs at the same level, is generally read as clinically significant obstruction at or beneath that segment. Comparing thigh, calf, and ankle in sequence lets you narrow the problem to an aortoiliac, femoropopliteal, or infrapopliteal distribution rather than simply confirming that something is wrong somewhere.
Segmental pressures inherit the same calcification limitation as the ABI, since they are still pressure measurements. That is precisely why the pulse volume recording waveform is read next to them. If segmental pressures look preserved but the waveforms are damped, the pressures are the measurement to distrust. For context on how a resting index is interpreted before segmental work is added, see our guide to normal ankle-brachial index ranges.
7. What Are the Limitations of Pulse Volume Recording?
Pulse volume recording is a physiologic study, not an anatomic one, and it should be presented that way. It tells you that perfusion in a segment is reduced. It does not tell you which vessel is narrowed, by how much, or whether the lesion is focal or diffuse. Those questions belong to duplex ultrasound or cross-sectional imaging, and a patient with limb-threatening findings needs prompt vascular referral rather than another physiologic test.
Documented technical and patient factors that degrade a pulse volume recording tracing include:
- Improper cuff size or placement, or a cuff applied too loosely
- Excessive cuff inflation pressure, which damps the recorded signal
- Severe oedema, obesity, or large limb circumference, all of which blunt detection of volume change
- Arrhythmia or low cardiac output states, which produce irregular or diminished waveforms
None of these are exotic. They are ordinary situations in a primary care or podiatry panel, which is why technique and staff training carry as much weight as the equipment itself.
How Do Independent Practices Add Pulse Volume Recording In Office?
Most practices do not buy a pulse volume recording device on its own. They add a multi-parameter vascular assessment that includes plethysmography alongside the indices they already use. The CMAT Advantage system from HealthWright Technologies takes that approach: its vascular measurements include the ankle-brachial index, the toe-brachial index, and volume plethysmography, and the wider assessment also evaluates autonomic function. The system is built on FDA-cleared component devices, and the ABI module carries 510(k) clearance K173696.
HealthWright Technologies sells and supports these systems for independent physicians and does not provide patient care itself. Practices considering an in-office vascular assessment usually weigh three things: whether their panel actually contains enough at-risk or symptomatic patients to justify it, whether staff can be trained to capture clean tracings consistently, and how the study will be documented. Our overview of in-office vascular assessment and our notes on PAD assessment in primary care cover those trade-offs in more depth.
On coding, non-invasive physiologic studies of the lower extremity arteries are reported with established CPT codes, and a complete bilateral study performed at three or more levels is reported with 93923. Studies may be billable under established CPT codes when they are medically necessary and documented, and coverage varies by payer, so verify current requirements before billing. Our 93923 billing guide walks through documentation expectations in detail.
Frequently Asked Questions About Pulse Volume Recording
Is pulse volume recording the same as an ABI?
No. An ABI is a pressure ratio comparing ankle systolic pressure with brachial systolic pressure. Pulse volume recording is a waveform showing the change in limb volume with each heartbeat. They are usually performed in the same sitting and interpreted together, because the waveform indicates whether the ABI value can be trusted.
Does pulse volume recording hurt?
It should not. The cuffs inflate to a low subocclusive pressure, generally in the 40 to 65 mm Hg range, which is well below the pressure needed to stop blood flow and lower than a standard blood pressure reading. Patients typically describe mild, brief snugness at each level.
Why would a patient need pulse volume recording if their ABI was normal?
Because a normal ABI is not always a reliable result. In patients with medial calcification from longstanding diabetes or chronic kidney disease, the arteries resist compression and the ABI can read normal or above 1.40 despite real disease. Pulse volume recording is not affected in the same way, so it helps resolve that discordance.
What does an abnormal pulse volume recording waveform indicate?
Loss of the dicrotic notch with a widened peak suggests mild change. A delayed upstroke, rounded peak, and reduced amplitude suggest more advanced obstruction, and a nearly flat tracing suggests severe reduction in perfusion to that segment. These findings describe physiology, not anatomy, and are interpreted by a clinician alongside the full study and examination.
Is there a pulse volume recording scale for grading severity?
There is no single numbered scale. A pulse volume recording is graded by contour and amplitude rather than scored. A normal tracing shows a rapid systolic upstroke, a sharp peak and a well defined dicrotic notch. Mild change widens the peak and loses the notch. Advanced change adds a delayed upstroke, a rounded peak and reduced amplitude. Severe change is a markedly damped, nearly flat tracing. Amplitude is also compared level to level and side to side, where an abrupt drop between adjacent cuffs carries more meaning than any absolute height.
What does pulse volume mean on a vascular report?
Pulse volume is the small increase in limb size that happens each time the heart pushes blood into a segment. The recorder converts that expansion into a tracing, so the study reports a shape rather than a number. That is the practical difference from an ankle-brachial index, which reports a pressure ratio. A pulse volume tracing describes the quality of perfusion at the level of the cuff.
What does an order for PVR with ankle pressures, bilateral, in the vascular lab include?
Bilateral means both legs are studied, so each level can be compared with its counterpart on the other limb. Cuffs sit at several levels on each leg, and each cuff records both a waveform and a segmental pressure at that level. Reading the two together is the point of the study. The waveform describes perfusion quality, the pressure helps localise where flow is being limited, and a gradient of roughly 20 mm Hg or more between adjacent levels is generally read as significant obstruction at or beneath that segment.
How is pulse volume recording different from a Doppler study?
A Doppler study records blood flow velocity and can show flow reversal, which is why Doppler tracings are described as triphasic, biphasic or monophasic. Pulse volume recording captures volume change and has no true reverse-flow component, so it is described by contour and amplitude instead: upstroke, peak, dicrotic notch and height. Borrowing the Doppler vocabulary for a pulse volume tracing makes the report harder for the next reader to interpret.
What CPT code is used for pulse volume recording?
Pulse volume recording is part of non-invasive physiologic studies of the extremity arteries rather than a standalone code. A complete bilateral lower extremity study at three or more levels is reported with CPT 93923. Code selection depends on the study actually performed and documented, and coverage varies by payer.
Talk to HealthWright Technologies
If you are evaluating whether an in-office vascular assessment that includes volume plethysmography fits your practice, we can walk you through the measurements, the workflow, and the training and support that come with it. HealthWright Technologies has supported independent physicians since 2000.
HealthWright Technologies, 60 Bear Creek Marina Road, Mansfield, GA 30055. Call (678) 322-7146 or email contact@healthwrighttechnologies.com. You can also contact our team directly.
This article is general educational information for clinicians and practice staff. It is not medical advice, a diagnostic protocol, or a substitute for clinical judgment, and patients should consult their healthcare provider before starting any new treatment. Diagnostic devices described here are not represented to diagnose, predict, or treat any disease on their own, and results are interpreted by a qualified clinician in the context of the full clinical picture. Clinical detail in this article is drawn from the 2024 ACC/AHA multisociety lower extremity PAD guideline and StatPearls, Noninvasive Physiologic Testing for Peripheral Arterial Disease.
CPT® is a registered trademark of the American Medical Association. Coding and coverage information here is general and educational. Code selection depends on the study actually performed and documented, coverage varies by payer, and reimbursement is not guaranteed. Verify current requirements with your payers before billing.
Ready to see the CMAT Advantage in your practice?
Book a free 25-minute demo: see the full PAD + autonomic workup and how the three established CPT codes apply, with no obligation. Backed by our 60-day buyback guarantee.
Book a Free Demo →